Current Water Situation in Our Area
Keep up to date with the current status of our resources and find out how you can help protect our local water supplies.
Stay informed about our water resources
Monitoring the groundwater levels that supply our region is a crucial part of ensuring our ongoing water resources for the future. To help you make informed decisions about your water use, we update the status of our groundwater levels each month.
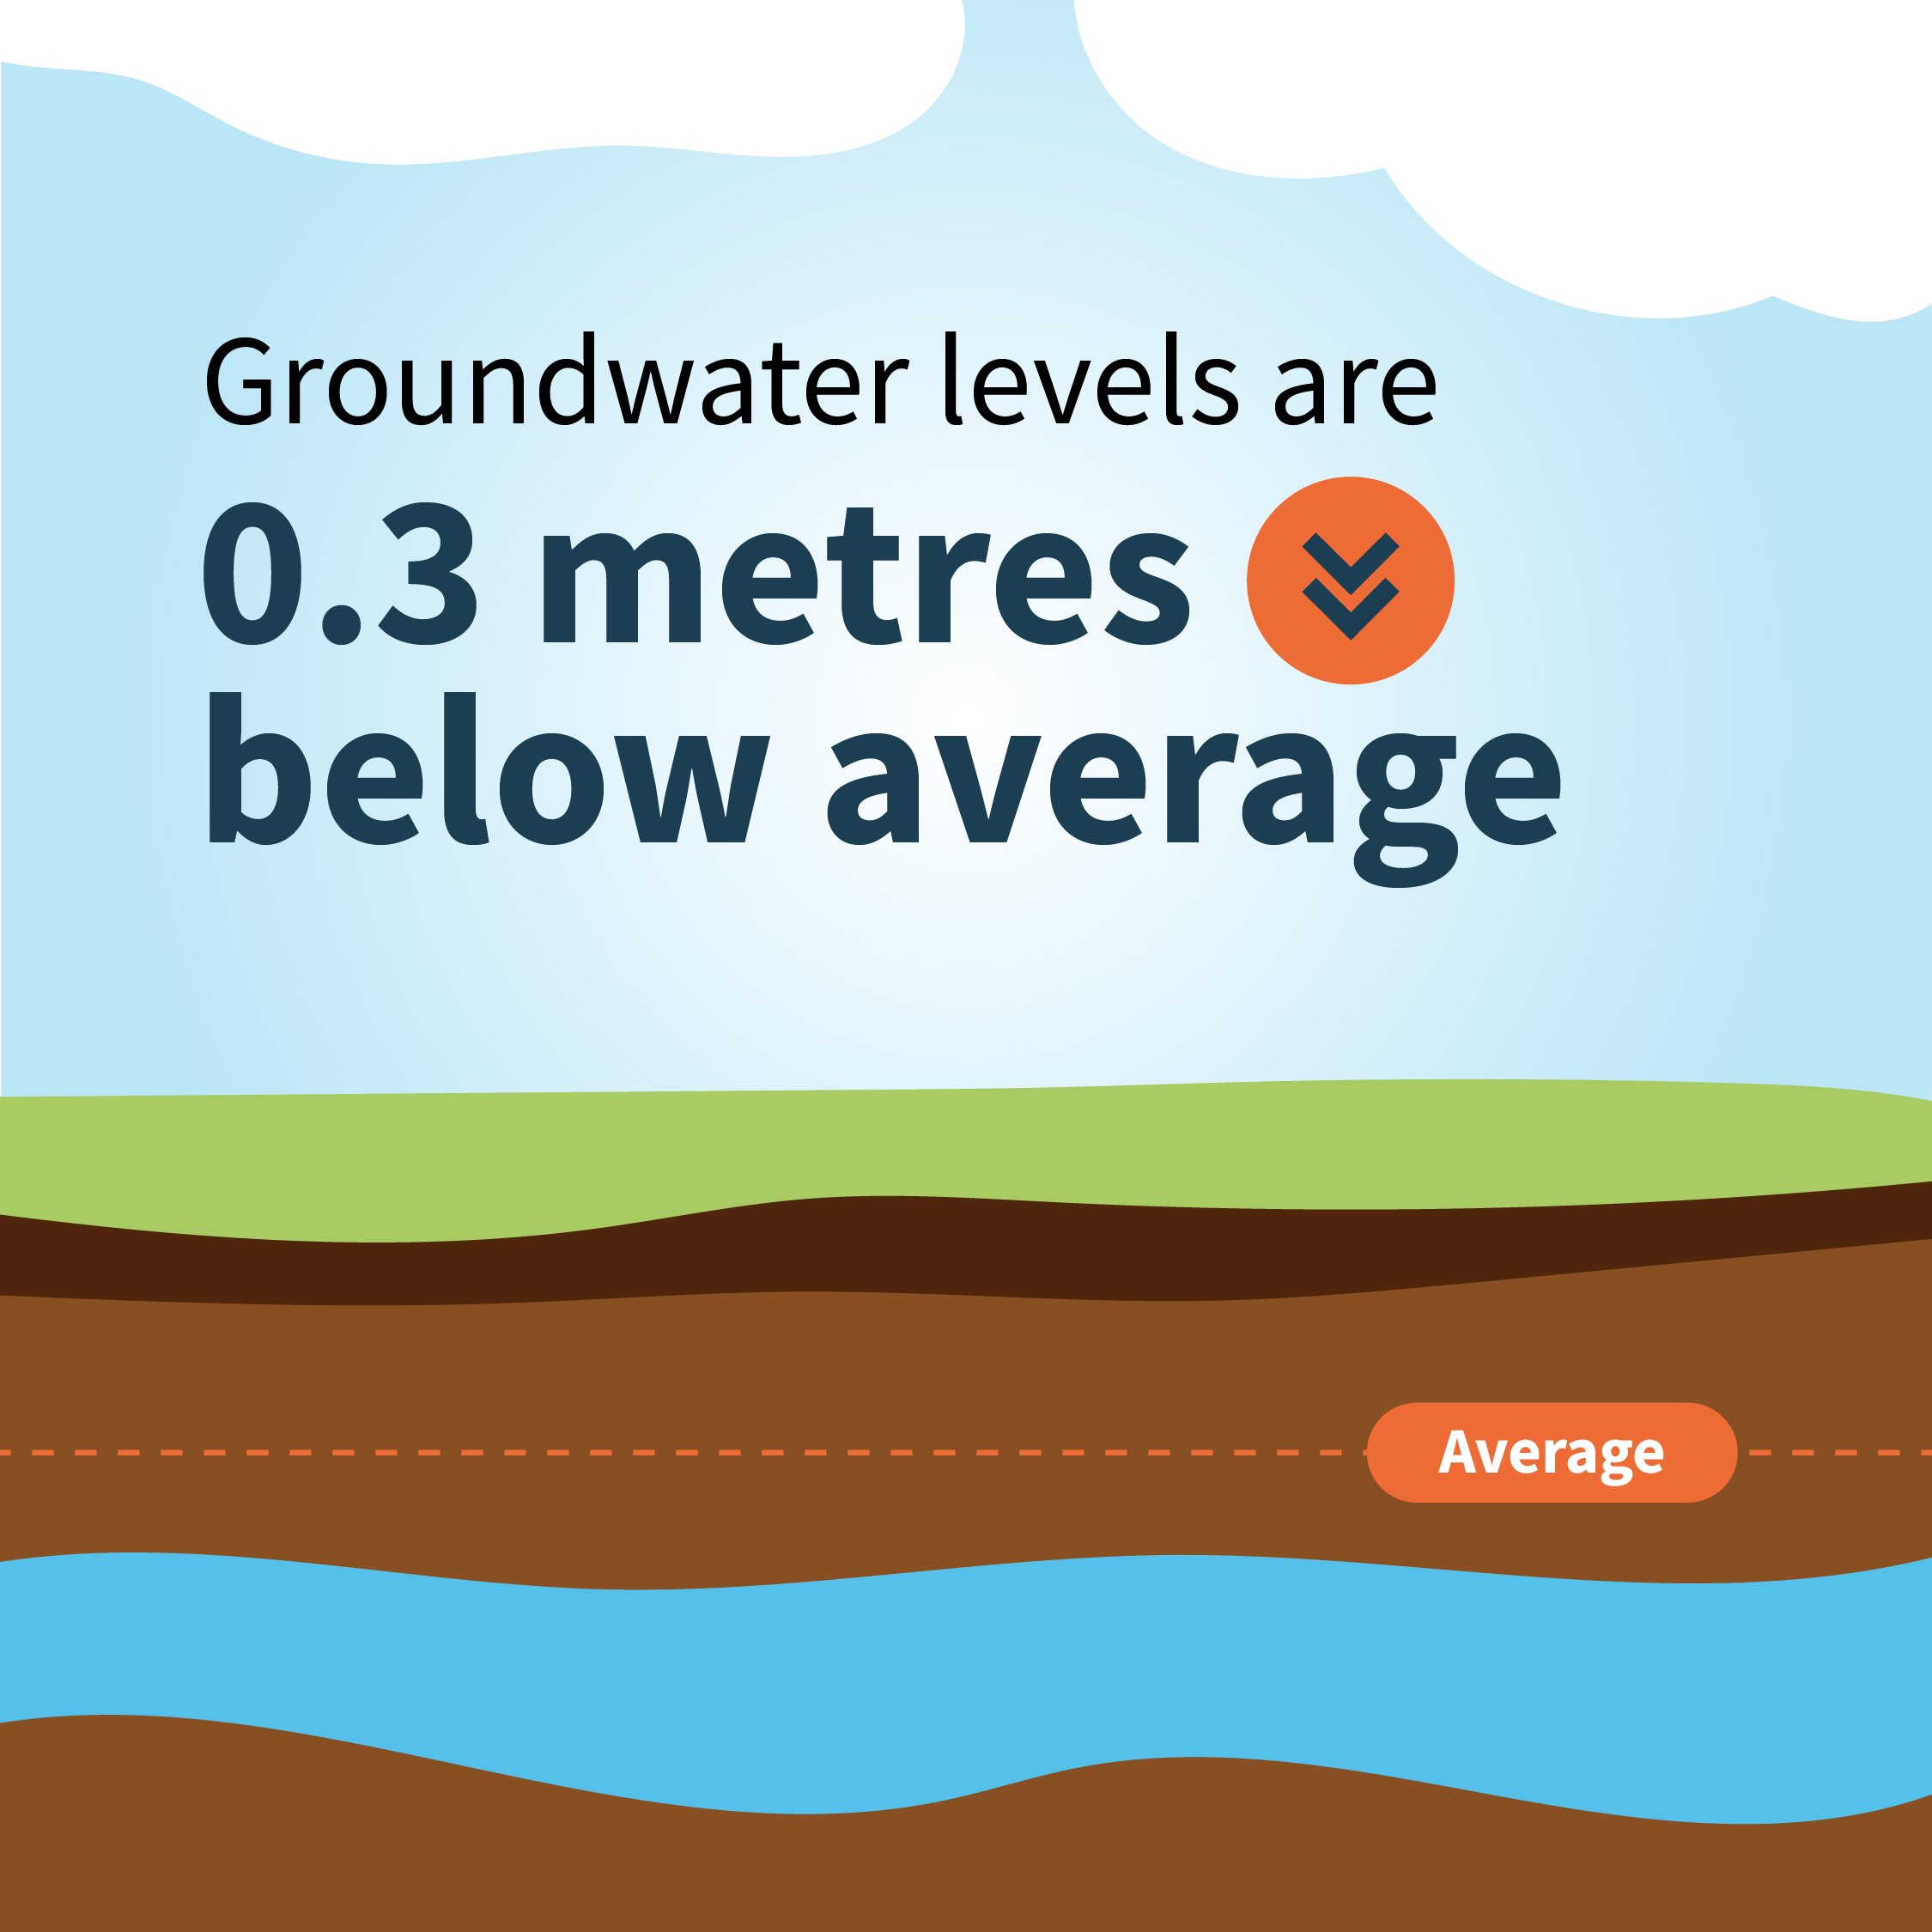
Groundwater Status
0.3 metres below average
Groundwater levels across our supply area are above normal for this time of year.
Rainfall Status
70% of monthly average
Rainfall levels across our supply area are below average for this time of year.
Drought Plan
No restrictions
We currently have no restrictions in place for water use in the area.
Last updated: 5 June 2026
Understanding your water supply
We currently supply around 178 million litres of drinking water each day to around 320,000 homes and business in West Sussex and Hampshire – the equivalent of 71 Olympic swimming pools. The water we supply currently comes from three main sources, 60% from boreholes and wells under our chalk landscape, 30% from groundwater springs, and 10% from the River Itchen.
Groundwater levels over time
Almost all the water that reaches your taps comes from the chalk rock under the South Downs that holds water, a bit like a natural underground sponge. This is known as an aquifer, and the water that’s stored there is groundwater.
Groundwater levels rise and fall each over the year depending on the rain, generally rising in winter and spring and falling in summer and early autumn.
Unlike rivers or lakes that can refill quickly when it rains, our underground sources take much longer to recover after periods of dry weather. This is because any rain simply needs to travel further through layers of ground to get back into the sponge.
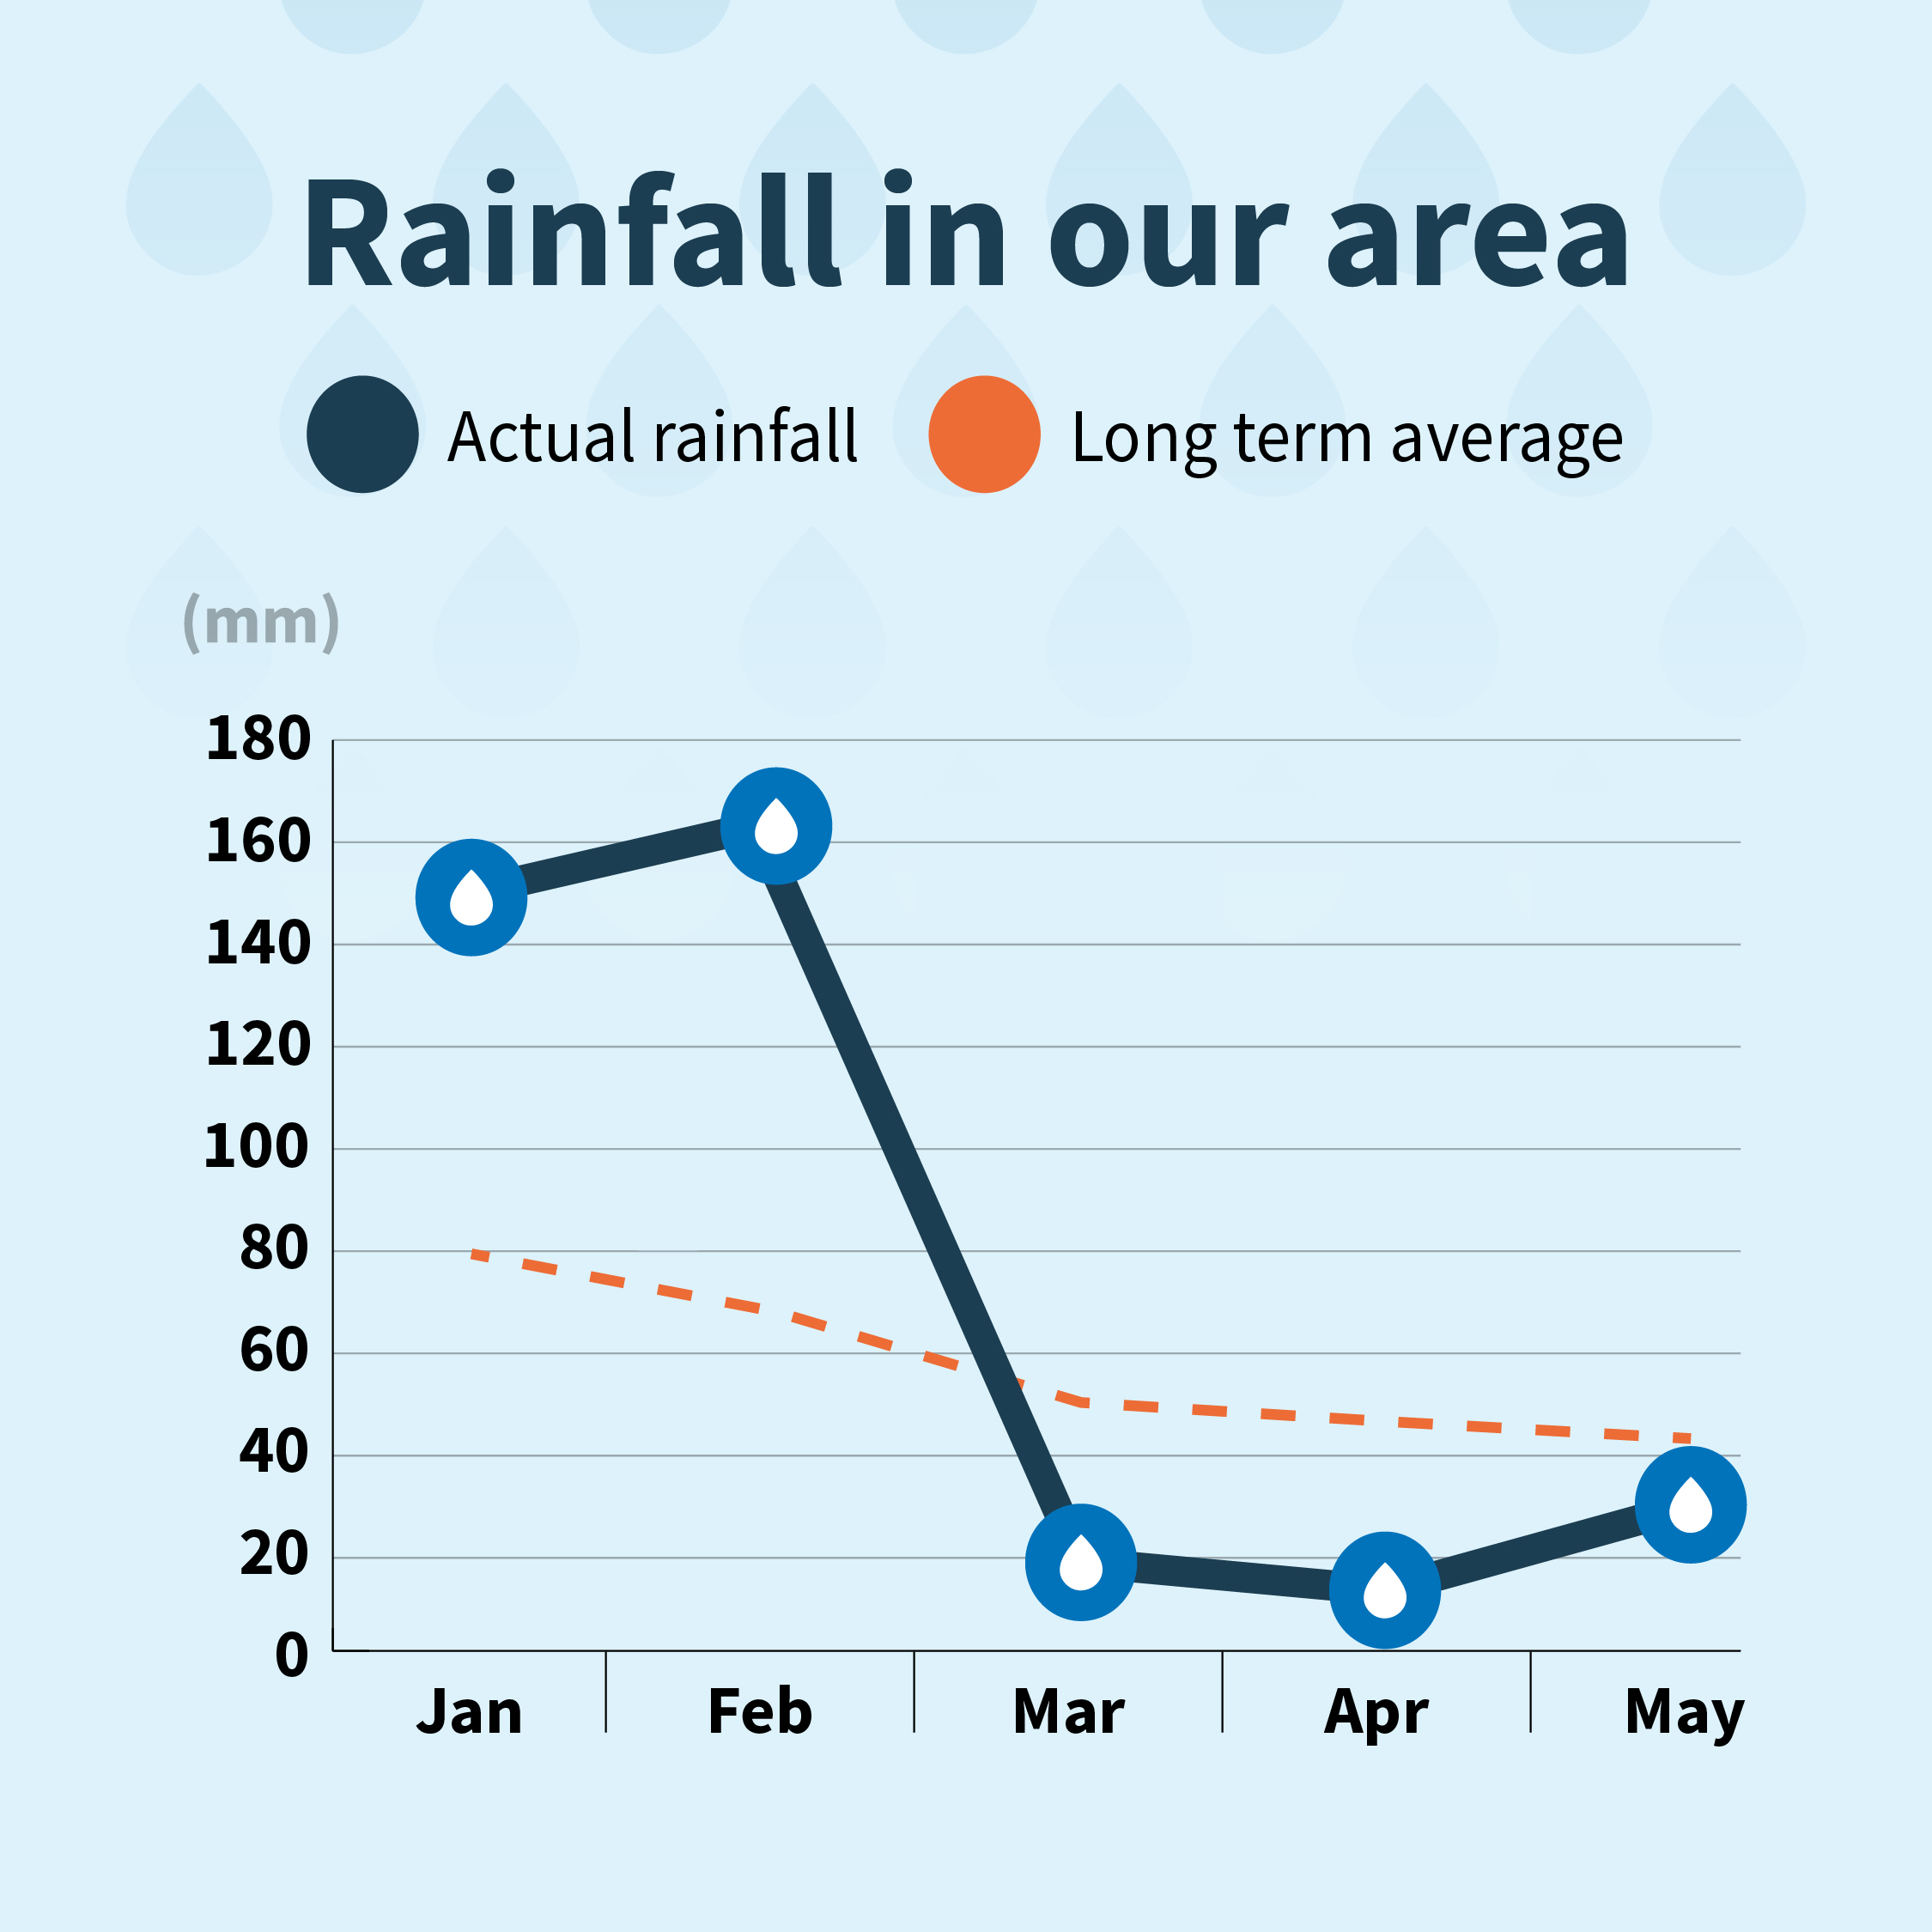
Rainfall compared to the long-term average
Rainfall is an important indicator of groundwater levels. Even after heavy rain, it can take time for the ground to become soft enough to let the water pass through to the aquifer.
Dry, hardened ground actually prevents water from soaking in and can contribute to flooding. We monitor the rainfall compared with the long-term average (LTA) to help us understand patterns and help manage and make decisions about our water supply.
The long-term average is calculated by using a 30-year historical average rainfall for each month.
Working together to protect our water supplies
Find out how you can help protect our water resources with our essential water saving tips, and find out more about the ways we are planning to protect our water supplies into the future.
Frequently asked questions
Groundwater is replenished when rainfall soaks through soil into underground aquifers. When rainfall is below average, recharge is reduced and groundwater levels suffer, which can affect water supply in dry months.
We update groundwater and rainfall data monthly, with additional updates during significant weather events.
The drought status in any area is based on several factors including historic rainfall, groundwater and reservoir levels. You can find out more about the measures we take during a drought event in our Dorught Plan.
The table shows the long-term average of monthly rainfall compared to the actual monthly rainfall.
| Month | Long-term Average | Actual Rainfall |
|---|---|---|
| January 2025 | 79.37mm | 53.80mm |
| February 2025 | 66.95mm | 52.60mm |
| March 2025 | 50.54mm | 3.70mm |
| April 2025 | 46.05mm | 20.90mm |
| May 2025 | 43.77mm | 20.60mm |
| June 2025 | 48.06mm | 41.50mm |
| July 2025 | 48.41mm | 60.50mm |
| August 2025 | 61.38mm | 43.50mm |
| September 2025 | 64.49mm | 109.90mm |
| October 2025 | 95.16mm | 88.50mm |
| November 2025 | 94.53mm | 64.14mm |
| December 2025 | 87.54mm | 82.23mm |
| January 2026 | 79.37mm | 149.18mm |
| February 2026 | 66.95mm | 162.97mm |
| March 2026 | 50.54mm | 19.14mm |
The Environment Agency reports on rainfall and river flow statuses. You can find out more about it on their government webpage.